Troms - Romsa - Tromssa: municipalities in numbers
Troms - Romsa - Tromssa (county) has 21 municipalities and 171,218 residents across 25,168 km², or 7 people per km². Population: +3.4% between 2016 and 2026.
- 171,218 residents
- 21 municipalities
- 25,168 km²
- 7 people/km²

Map and records: Troms - Romsa - Tromssa
Population change over 10 years
All municipalities in Troms - Romsa - Tromssa
Click a column heading to sort the table.
| Municipality | Population | Population change over 10 years | Population density | Area | Net migration per 1,000 inhabitants | Share of inhabitants aged 65 and over |
|---|---|---|---|---|---|---|
| Tromsø | 79,943 | +8.8% | 32.3 people/km² | 2,472 km² | 2.0 per 1,000 inh. | 16.0% |
| Harstad - Hárstták | 25,204 | +2.1% | 58.9 people/km² | 428.0 km² | 2.7 per 1,000 inh. | 22.6% |
| Senja | 14,946 | −0.3% | 8.0 people/km² | 1,861 km² | 2.3 per 1,000 inh. | 23.2% |
| Målselv | 6,819 | +1.2% | 2.1 people/km² | 3,203 km² | 5.4 per 1,000 inh. | 21.5% |
| Balsfjord | 5,625 | −1.3% | 3.9 people/km² | 1,440 km² | 5.9 per 1,000 inh. | 25.1% |
| Nordreisa - Ráisa - Raisi | 4,863 | −0.7% | 1.5 people/km² | 3,334 km² | 13.0 per 1,000 inh. | 23.4% |
| Dielddanuorri - Tjeldsund | 4,144 | −4.2% | 5.3 people/km² | 775.0 km² | −9.9 per 1,000 inh. | 29.6% |
| Bardu | 4,004 | −0.4% | 1.6 people/km² | 2,514 km² | 8.2 per 1,000 inh. | 21.5% |
| Sørreisa | 3,528 | +2.2% | 10.2 people/km² | 347.0 km² | −1.1 per 1,000 inh. | 21.8% |
| Kvæfjord | 2,901 | −4.2% | 5.8 people/km² | 497.0 km² | 20.7 per 1,000 inh. | 26.0% |
| Skjervøy | 2,802 | −4.0% | 6.0 people/km² | 465.0 km² | 10.0 per 1,000 inh. | 22.2% |
| Lyngen - Ivgu - Yykeä | 2,732 | −4.5% | 3.4 people/km² | 795.0 km² | 4.8 per 1,000 inh. | 31.0% |
| Karlsøy | 2,235 | −2.1% | 2.1 people/km² | 1,051 km² | 10.7 per 1,000 inh. | 30.3% |
| Salangen | 2,132 | −4.4% | 4.9 people/km² | 438.0 km² | 13.1 per 1,000 inh. | 26.3% |
| Gáivuotna - Kåfjord - Kaivuono | 1,939 | −9.8% | 2.0 people/km² | 950.0 km² | 0.5 per 1,000 inh. | 31.3% |
| Storfjord - Omasvuotna - Omasvuono | 1,848 | −0.9% | 1.3 people/km² | 1,477 km² | 11.9 per 1,000 inh. | 28.8% |
| Ibestad | 1,287 | −8.3% | 5.5 people/km² | 234.0 km² | 7.0 per 1,000 inh. | 35.7% |
| Kvænangen | 1,125 | −8.6% | 0.6 people/km² | 2,008 km² | 5.3 per 1,000 inh. | 30.2% |
| Dyrøy | 1,077 | −7.0% | 3.9 people/km² | 277.0 km² | 14.9 per 1,000 inh. | 32.5% |
| Gratangen - Rivtták | 1,062 | −6.6% | 3.5 people/km² | 306.0 km² | 8.5 per 1,000 inh. | 28.3% |
| Loabák - Lavangen | 1,002 | −4.7% | 3.4 people/km² | 296.0 km² | 20.0 per 1,000 inh. | 27.3% |
Troms - Romsa - Tromssa compared with the national figures
Population-weighted averages for rates; totals for counts.
| Indicator | Troms - Romsa - Tromssa | Norway |
|---|---|---|
| Net migration per 1,000 inhabitants | 3.6 per 1,000 inh. | 4.0 per 1,000 inh. |
| Share of inhabitants aged 65 and over | 20.5% | 19.2% |
| Share of inhabitants under 18 | 18.0% | 19.6% |
| Share of population with immigrant background | 16.1% | 21.8% |
| Total dwellings (occupied and unoccupied) | 94,660 | 2,760,619 |
| Share of dwellings built before 1946 | 8.3% | 15.9% |
| Share of dwellings built after 2000 | 24.6% | 27.0% |
| Share of dwellings in detached, semi-detached and terraced houses | 75.9% | 67.9% |
| Share of dwellings in blocks of flats | 17.2% | 26.7% |
| Cabins and holiday homes per 1,000 inhabitants | 78.1 per 1,000 inh. | 80.4 per 1,000 inh. |
| Establishments | 18,618 | 656,492 |
| Establishments per 1,000 inhabitants | 108.7 per 1,000 inh. | 116.7 per 1,000 inh. |
| Employed persons as a percentage of the population aged 15–74 | 70.1% | 68.2% |
| Registered unemployed as a share of the population aged 15–74 | 0.6% | 1.2% |
| Passenger cars in own-account transport per 1,000 inhabitants | 530 per 1,000 inh. | 505 per 1,000 inh. |
| Share of electric cars among passenger cars in own-account transport | 20.7% | 32.8% |
| Share with university or university college education | 37.2% | 38.3% |
| Life expectancy at birth (average of women and men) | 82.8 years | 83.1 years |
| Active businesses in the Central Coordinating Register | 23,737 per 1,000 inh. | 915,761 per 1,000 inh. |
| Active businesses in the register per 1,000 inhabitants | 138.6 per 1,000 inh. | 162.7 per 1,000 inh. |
| Businesses registered in the last 12 months per 1,000 inhabitants | 12.0 per 1,000 inh. | 13.4 per 1,000 inh. |
Frequently asked questions
How many municipalities are there in Troms - Romsa - Tromssa?
Troms - Romsa - Tromssa has 21 municipalities. The most populous is Tromsø, with 79,943 residents.
What is the population of Troms - Romsa - Tromssa?
Troms - Romsa - Tromssa has 171,218 residents (2026), or 7 people per km².
Which municipality in Troms - Romsa - Tromssa is growing fastest?
Tromsø has the fastest growth in Troms - Romsa - Tromssa over 10 years: +8.8%.
Other regions
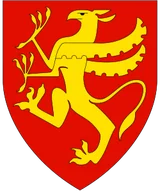
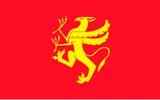
Coat of arms: Own work This W3C-unspecified vector image was created with Inkscape ., Public domain, Wikimedia Commons · Flag: PNG flag by AlexR.L. (CC-BY-SA 3.0)Coat of arms by Havarhen (PD-Norwegian CoA)SVG flag by , CC BY-SA 3.0, Wikimedia Commons. Coats of arms and flags are shown for identification only; this site is not affiliated with any public authority.

